Barrier Free - Happy​​ Work, Happy Life

Survey

            Through the interview and the literature analysis methods in social studies, we completed the basic structure of our project. Focusing on the study core of our project, we interviewed the key group of our project via the internet. In the process of interviewing, we acquired primary sources, and through these interviewing documentaries, whilst comparing them with the documents we collected, we were able to add information to the incomplete parts of our project.
            Furthermore, to be more accurate about the environment we live in, corresponding to the intensity of the target figure of our research project or the familiarity and the relevance to the content (citizens’ understanding of our project research), we used the technique of questionnaire statistical method in social quantitative research. Asking people to fill out our online questionnaire, which process lasted 6 weeks, we received about 305 responses. Analyzing, used to reinforce and review the result we gain from social quantitative research mentioned previously, we produced relatively objective and comprehensive results for our project.
            However, the questionnaire was slightly insufficient, creating a limitation of our research expansion. As a result, we were only able to do limited analysis of the collected samples. Even so, these questionnaires also had sufficient objective research assistance for the research of this topic, enabling our team to have a quality understanding about how many ideas the community, in general, are aware of our topic. Additionally, this helped us in understanding our qualitative research, understanding the phenomenon that can’t be explained by literature analysis, and furthermore analyzing the deficiencies.

Your Knowledge about the Disabled

  Diagram 1: made by our team

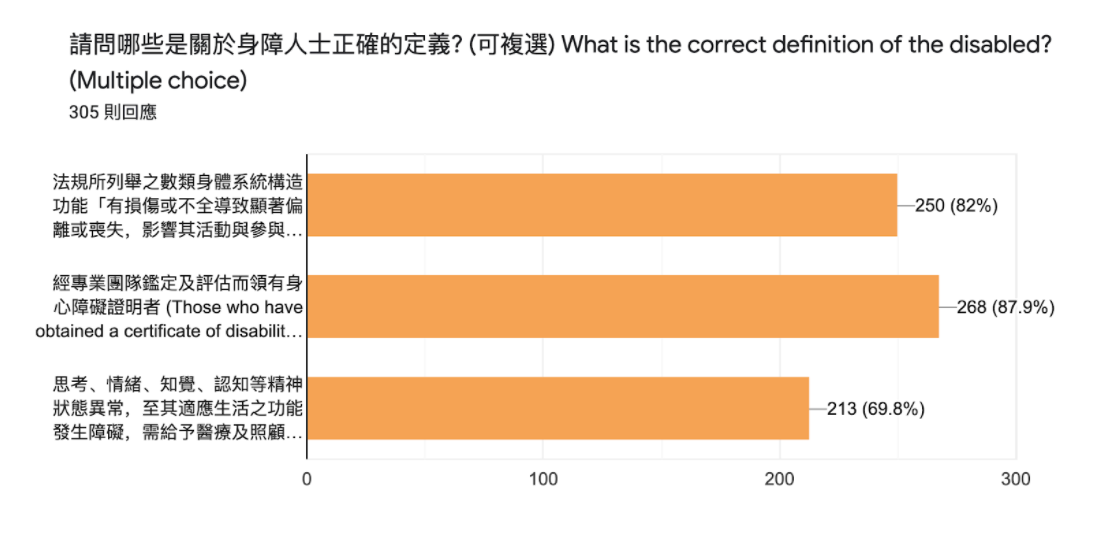
           According to the respondents, about 250 of them believe the correct definition of the diabled is: the functions of several types of body systems listed in the regulations “have damage or insufficiency leading to significant deviation or loss, affecting their activities and participation in social life”; while about 268 people (some overlapping with the first choice) believe that disabled means those who have obtained a certificate of disability after being appraised and assessed by a professional team. On the other hand, about 213 respondents believe illnesses that require medical treatment and care due to abnormal mental states such as thinking, emotion, perception, and cognition, until the function of adapting to life is impaired; the scope includes mental illness, psychosis, alcohol addiction, drug addiction is the correct definition for the disabled. Instead of being the correct definition for the diabled, the third choice is the correct definition for the mentally ill, which is not a correct answer to this question. Since then, we can conclude that the majority understand the correct definition for the disabled. But since this is a multiple choice, about 70% of the respondents have misunderstand the definition of the mentally ill with the disabled.

  Diagram 2: made by our team

           According to the respondents, about 91.5% of them know about Stephan Hawking(Amyotrophic lateral sclerosis) and 89.5% of them know about Ludwig van Beethoven(deaf). On the other hand, only 1.3% of them know none of the famous disableds. This shows the majority have basic cognition about the famous disableds.

  Diagram 3: made by our team

           The data collected from the interviewees showed that about 149 of the interviewees knew: If the total number of employees in private institutions reaches 67, there should be 1% of disabled employees; those who do not meet the standard must pay the difference subsidy to the Employment Fund for the Disabled. The first choice, which about 45% of the interviewees believe is a policy presented by the government to increase employment opportunities for the disabled, is actually incorrect. The first choice states: if the total number of employees in a public enterprise reaches 24, there should be 3% of disabled employees; those who do not meet the standard must pay the difference subsidy to the Employment Fund for the Disabled. This choice is actually similar to the second choice(correct choice) but with different (incorrect) numbers. The third choice: promote the "Job Redesign" activity to encourage organizations to give precedence to handicapped employees to train and design, showing the understanding from 115 respondents about a policy the government promotes. Last but not least, 101 of them did not know any policies promoted by the government.

  Diagram 4: made by our team

           According to the graph, the disability care association that most of our respondents (46.9%) know is the Taiwan Disability Care Association. The second is The Cerebral Palsy Association of R.O.C, and the third most is the Taiwan Disability-Free Association. What’s out of our expectation is that the number of people who voted for “none of the above”, 33.1% of our respondents, is more than those who voted for the third most well-known association, which is only 30.8% of our respondents.

  Diagram 5: made by our team

           According to the diagram, the kind of disability most people know is the first category (nervous system structure and mental and mental functions: intellectually impaired, vegetative, dementia, autistic, chronic mentally ill, intractable epilepsy), which is 76.1%. The second most is the second category (Eyes, ears and related structures, sensory functions and pain: visually impaired, hearing impaired, balance impaired), which 73.4% of our respondents know about. The third most, 65.2%, is the third category (the structure and function of sound and speech: persons with voice and language dysfunction).

  Diagram 6: made by our team

           According to the data, most people believe that one of the effects on the guardians of the disabeled is the economic dilemma. Runner-up is the convalescent dilemma, the third is family relationship dilemma, the fourth is parenting dilemma, and the least is social welfare dilemma. This also shows that most of our respondents worry about economic effects more.

  Diagram 7: made by our team

           According to the collected data, most of the respondents believed that the percentage of the disabled that aren’t inherent is 21% to 60%. Only some chose more than 60% or less than 21%. The correct answer is 51.0%, which meets ​most of the respondents’ expectations.

  Diagram 8: made by our team

           According to the graph, with a high percentage of 83.9%, 82%, and 81.6% of interviewees believing the main causes of disabilities are innate, acquired diseases, and traffic accidents. Only a small percentage (46.9%) of interviewees choose family and social environmental factors as the cause of disabilities.

  Diagram 9: made by our team

           According to the diagram above, about 29.8% of the respondents don’t know any of the vocational training modes for the disabled. More than half of the interviewees (56.7%) believe special class training helps the disableds by adjusting the training method according to the characteristics of the physically and mentally handicapped, there are also professional counseling and Provide appropriate assistive devices to assist in training to increase the effectiveness of vocational training and learning and 55.7% of them choose integrated training. While the lowest percentage of 35.1% choose digital learning.

  Diagram 10: made by our team

           According to our research, out of 305 people, 34.1% of the respondents believe that the disabled can enjoy discounts on domestic public transportation (for example: Rehabilitation Bus), access to public scenic spots or recreational places and other related privileges, special parking space identification certificates, vehicle license plates and parking fee discounts(Social Participation); while 27.5% of them believe the disabled have ​​living allowances, subsidies for social insurance premiums for the physically and mentally disabled, subsidies for assistive devices, interest subsidies for rent and housing loans, reductions and exemptions of school expenses for students with disabilities and children of the disabled, use of life-sustaining equipment or necessary living for the physically and mentally disabled at home Discounts on electricity use for assistive devices, subsidies for day care and residential care costs, low-interest loans or rent subsidies for the purchase or lease of shops, vendors, interest and rent subsidies for the purchase of parking space(economic security); 22% of them believe there are special deductions for physical and mental disabilities, tax deductions; last but not least, 16.4% of them believe the disabled will get supportive services, such as career counseling assessment, vocational training, employment services, job redesign, entrepreneurship counseling, family care, personal care, life reconstruction, and career transfer.

  Diagram 11: made by our team

           According to the collected data, more than half (50.8%) of our respondents don’t know any of the incentives the government has for the disabled. On the other hand, 28.5% know about the basic salary of 25,250 NTD per month, 23.3% know about the 5,000 NTD reward, 16.7% know about the fewer working hours than ordinary employees, and 15.1% are aware of their subsidies to participate in domestic and foreign exchange activities that are not related to the business.

Treating the Disabled:

  Diagram 12: made by our team

           With the scale from one to five 46.6% of the respondents believe that the disabilities are treated with the scale of “3”. But only 15 out of 305 respondents believe that the disabilities are fully well treated, showing that there are still spaces for improvement.

  Diagram 13: made by our team

           According to the graph above, most of the respondents (86.2%) give precedence to the disabled people or assist them (55.7%). Only 3.9% of people ignore them. This means that most people will help the disabled people friendly and kindly.

  Diagram 14: made by our team

           According to the diagram, only 9.5% of the interviewees answer correctly (above one million disabled) while the majority(90.5%) don’t know the exact number of the disabled. This concludes that most people don’t care about the conditions of those disabled.

  Diagram 15: made by our team

           According to the respondents, 77% of them have not seen any disabled being bullied or teased. Only a small percentage of respondents (23%) experienced the unfairness of the disabled. The respondents who said yes explained their answer: Some said that people with disabilities may have more difficulty finding jobs due to some psychological or physical factors, which may also make companies reluctant to employ these people with disabilities (unfair job opportunity). Others say that the news reports people with various disabilities being bullied in public places. They also said that in Taiwanese schools, it is inevitable that the "special" classmates in the class are sometimes verbally bullied. They also encounter problems such as people maliciously jumping in line, deliberately occupying the fraternity seat, homestays refusing check in, criticized for poor work ability and attitude, improper bus operation causing wheelchairs to fall, and even getting kicked off the bus by the bus driver.

Have you ever helped any disabled people?

  Diagram 16: made by our team

           According to the interviewees, the majority (83.3%) helped disabled people before. Only a small percentage (16.7%) answered “no” showing that most people in Taiwan are friendly and willing to help the disabled.

  Diagram 17: made by our team

           According to the graph above, most people 68.2% donate to charity to help the disabled and the second most is to fundraise. Also, only 15.4% of interviewees didn’t help which concludes that most people helped the disabled people by donating.

Personal Experience

  Diagram 18: made by our team

           According to the diagram, 39.7% of the interviewees have disabled people nearby and 60.3% of them don’t. This shows that this topic is related to us and happens in people’s daily life.

  Diagram 19: made by our team

           According to the collected data, almost half of our respondents know people with moving function disabilities. This is probably because moving function disability is the most common kind of disability. Another reason might be that moving function disabilities are the most conspicuous, meaning that people will most likely see it instead of seeing people’s intellectual disability or mental disability.

  Diagram 20: made by our team

           From the diagram above, we can see the difficulties people encountered while taking care of the disabled ones. They conveyed their problems, which includes communicating difficulties, difficulties to leave the house, financial difficulties, and of course, lack of patience. Communication difficulties were the most mentioned.

  Diagram 21: made by our team

           The majority of our respondents have not received help from any disabled people. For the rest of them, 1 person had been helped by Yu-Cheng Social Welfare Foundation, while another person had been helped by Angel Heart Family Social Welfare Foundation.

Happy Work

  Diagram 22: made by our team

           According to the respondents, most of them (88.2%) don't know the Happy Work Organization and only 11.8%​ of them know it. This shows most people don't understand non government organizations well or they don't care about those organizations.

  Diagram 23: made by our team

           According to the respondents, the majority of them did not know about “Happy Work” before. Demonstrating that this organization is still not widely known. Still, 60 people have known about Happy Work from their family and friends.

  Diagram 24: made by our team

           According to the graph above, the majority (80.3%) don’t know Happy Work since they chose scale 1 and only 1.3% of interviewees chose scale 5. This shows that most people only listen to Happy Work before in the news but don’t know what it is exactly.

  Diagram 25: made by our team

           Based on this bar graph, we can see that about 70% of our respondents believe that people with disabilities are willing and able to participate in work activities after being assessed by the work facility which is correct. Which is also correct is disabled that are 15 years old or up and disabled that are 15 years old or up, each with about 40%( 42% and 41%) of the respondents choosing that option. For answers that are incorrect, which is family in poverty and students that have heavy course load only each have 15.4% and 11.1% of the respondents choosing that option.

  Diagram 26: made by our team

           According to the diagram, only 37% of the respondents answered correctly (one to one coursework enhancement) while others choose different options. This shows that most respondents might not understand happy work completely.

  Diagram 27: made by our team

           According to the bar graph, about 60% of the respondents know one of the service points of Happy Work which is “ Happy Work station 1” and 40.7% of the respondents knew the service point of Happy Work at “Happy village day care”. For the left over options, although each option has about 20-30% of the respondents believe that there is a service point of Happy Work, these three points do not have a service of Happy Work.

  Diagram 28: made by our team

           According to the diagram, almost every respondent(90.2%) believes Happy Work accepts government recognition and evaluation since they won first class evaluation in 109. Only a few people choose the wrong option, this concludes that most people know Happy Work passed the government's inspection.

  Diagram 29: made by our team

           According to our respondents, each choice has about 50% of the respondents. With all the options being correct, it shows that at least half of our respondents have some basic knowledge about the donation process to Happy Work.