
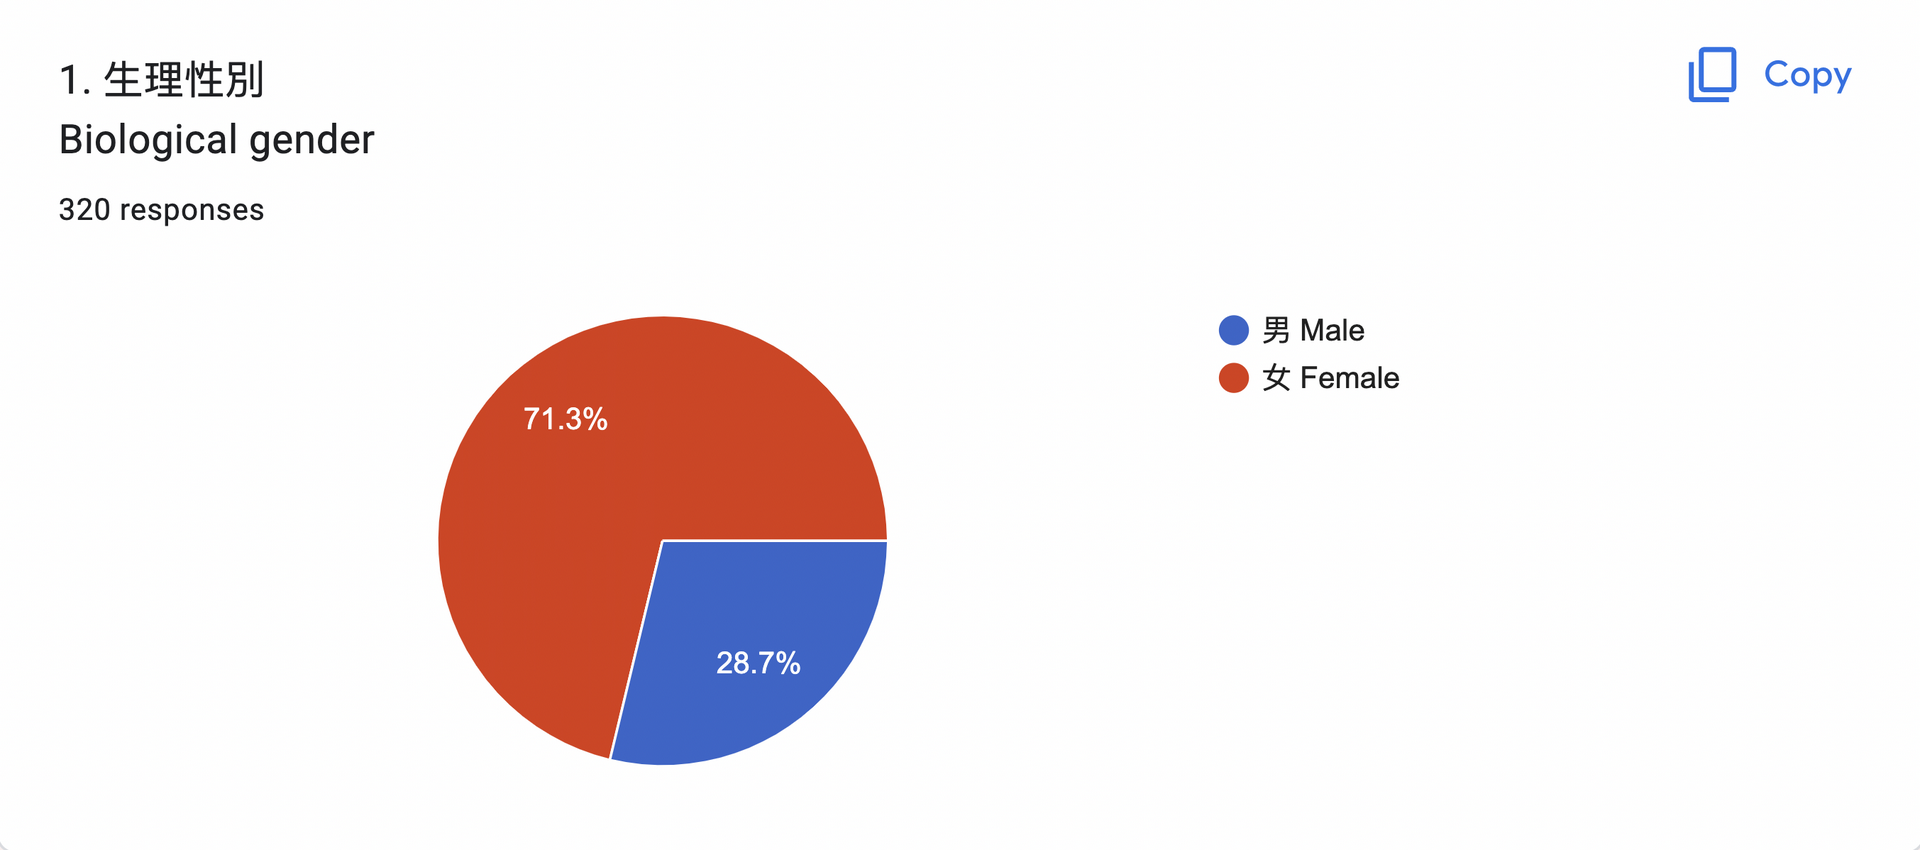
According to the graphic, females are more likely than males to complete the survey. This could be due to the fact that females care more about homeless individuals than males. Females have a more emotional attitude, whilst males have a more rational mindset.
According to this chart, the people who fill out this chart are primarily college graduates, followed by the junior high, master, senior high, and elementary if less, indicating that there will be more people with at least acceptable knowledge. There are more college students than any of the other backgrounds, this means people who receive this survey and are at least college students are more likely to answer this survey, and most people replying to this survey graduated and started working after college. The following number is from Junior High School, which could be affected by the fact that we have sent this survey to everyone in our school, and junior high school students are more likely to answer this survey than senior high school students.


This chart shows that the majority of people who fill out the form are between the ages of 13 and 18 and between the ages of 46 and 55, allowing us to compare the viewpoints of different age groups on homelessness. The age group occurs from 13 to 18 because there are plenty of people who answered this survey from our school, which can be proven by the chart from question 2. People who graduated from universities could be in any age group above 24 years old, so the age group is not limited.
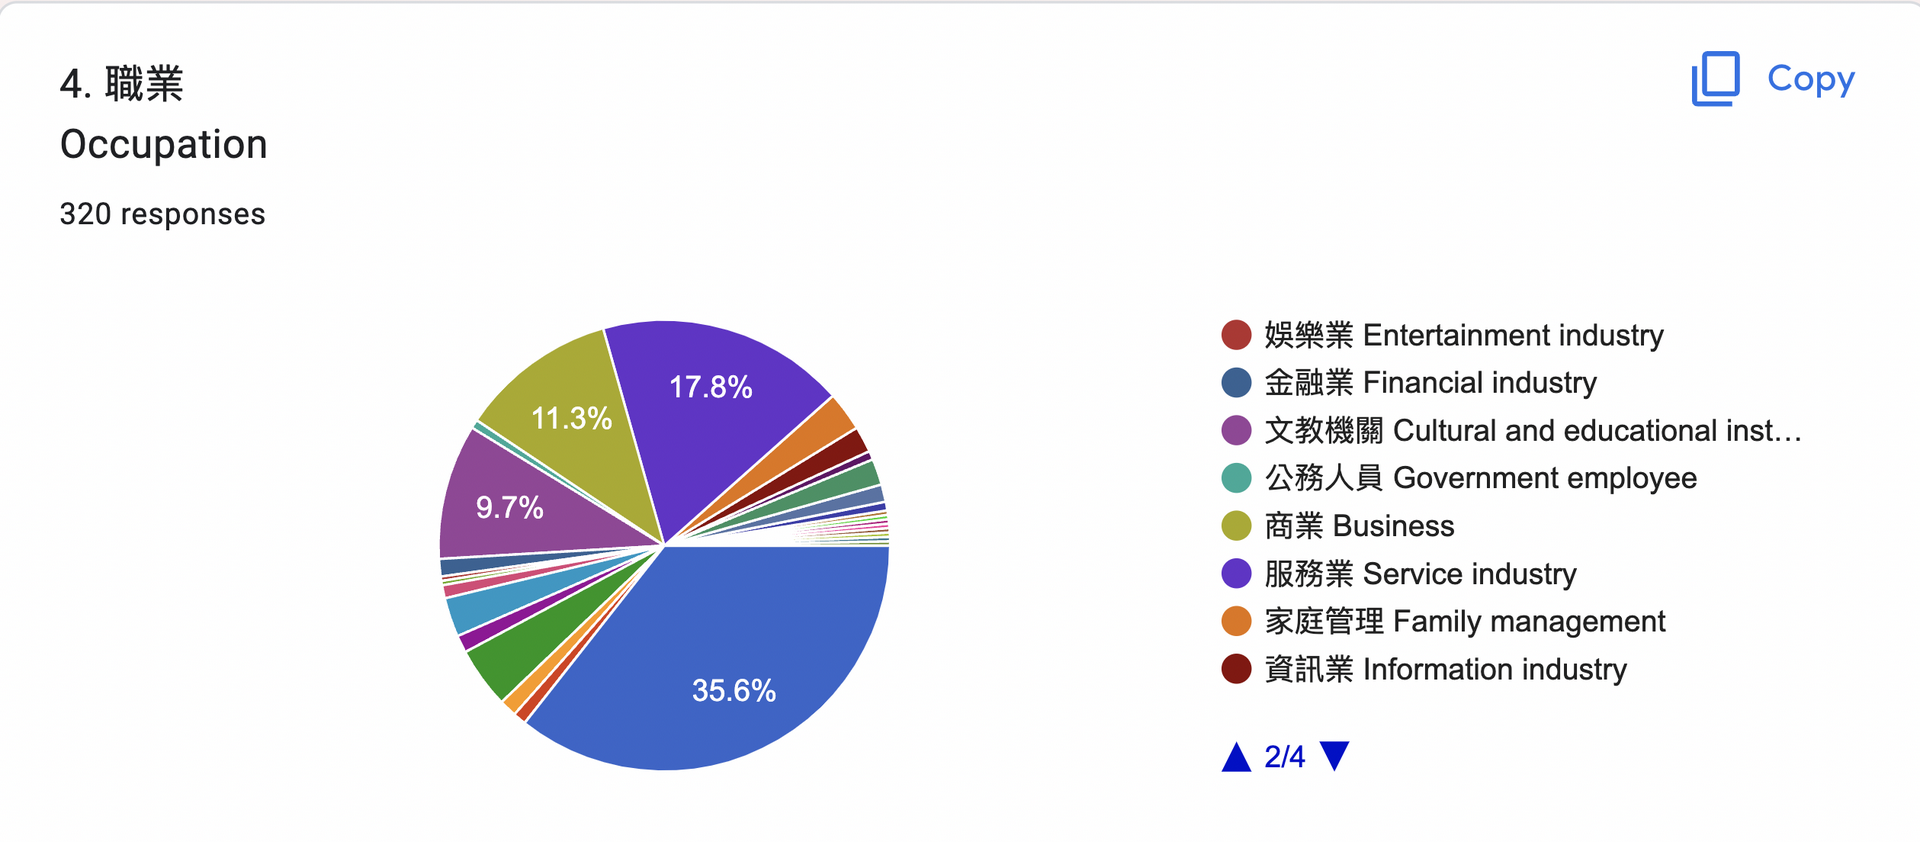
We may infer from the data above that more students responded to this survey than any other group because we sent it to everyone in school. From all other choices, we may infer that people who replied to this survey have different jobs, which means they get to know different people and go through different environments and lives, which makes our survey more reliable and valid because we get a wider range of opinions from various types of people.
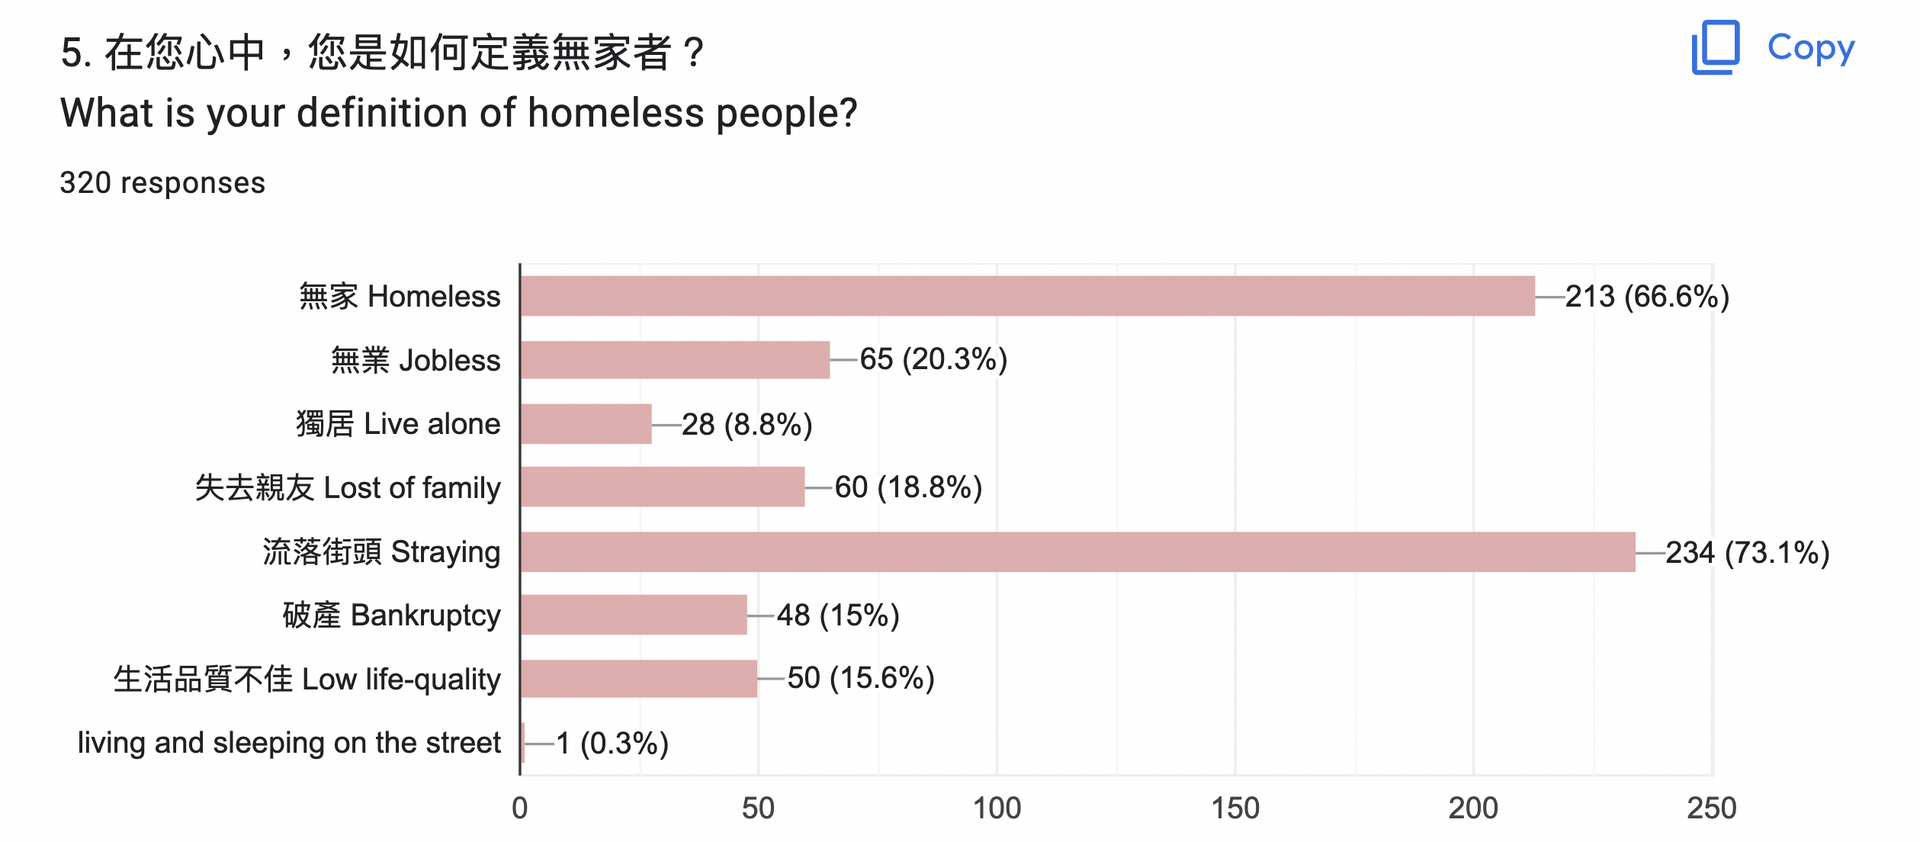
Accordingly, we know most people believe that homeless people are those who are homeless or live on the street; however, some believe that homeless people are just those who are unemployed or have a bad quality of life. We can conclude from this that people's understanding of homeless individuals is not limited to those who do not have a safe shelter, but also to those who have lost vital possessions, such as money or family, to become homeless.
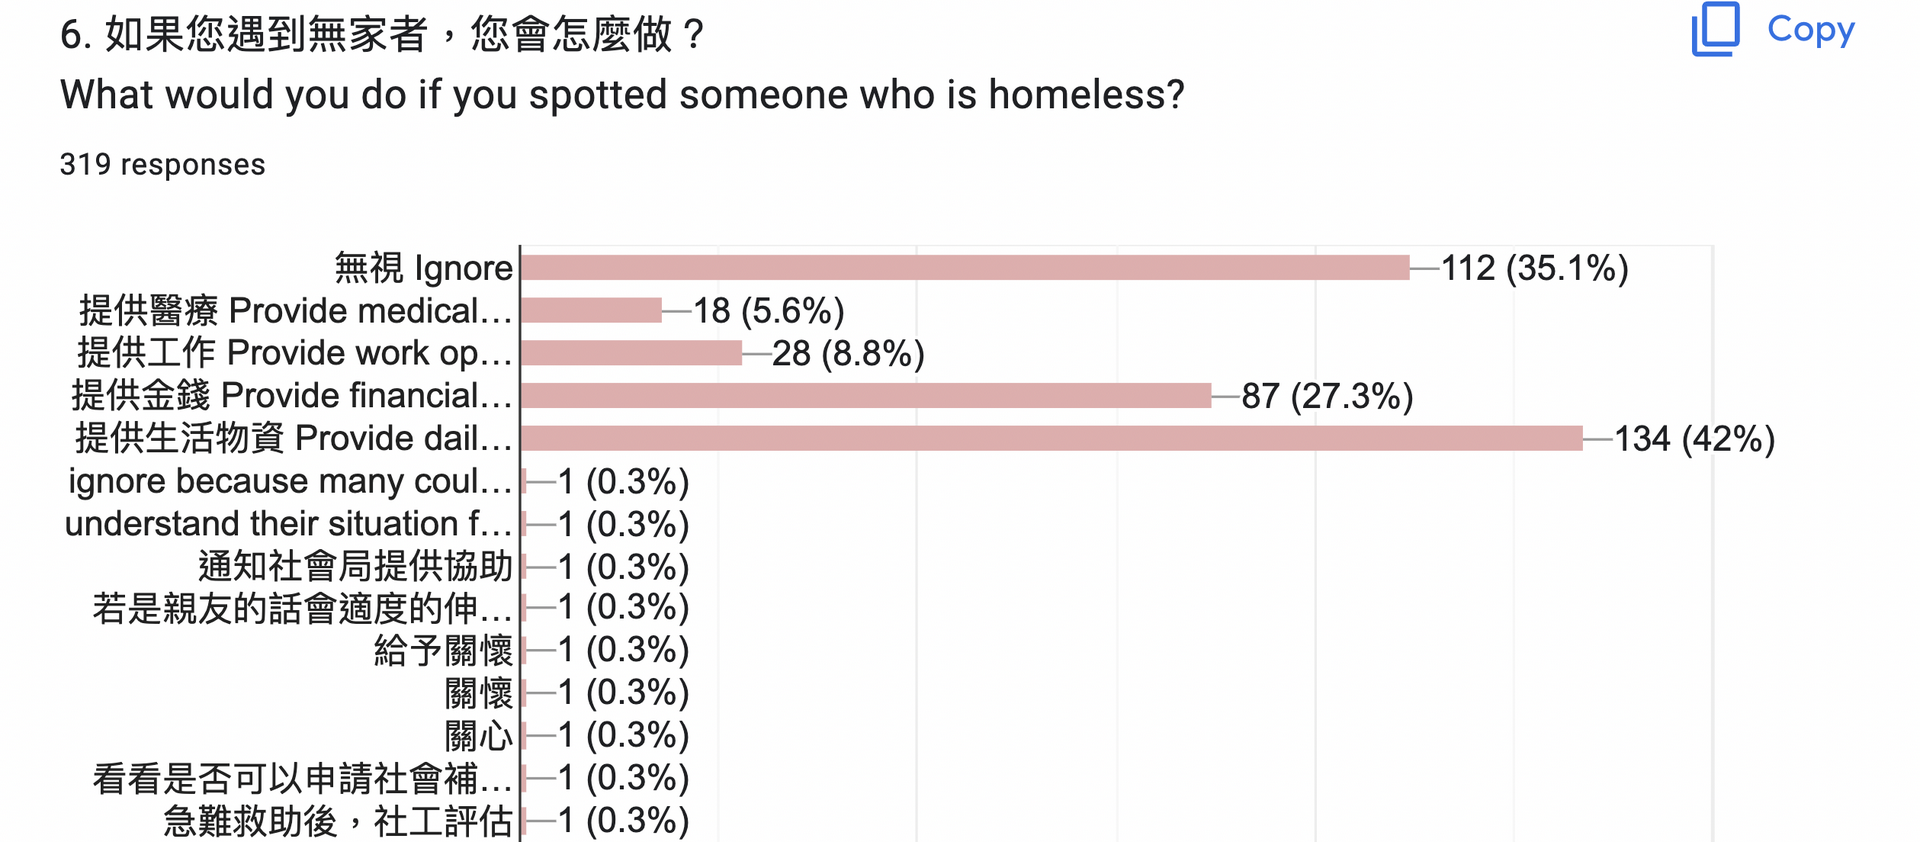
According to the chart above, most individuals provide daily essentials and financial support to homeless people, yet 35.1% choose to ignore the homeless. We know that most homeless populations have employment and can obtain daily basics, thus fiance support should be the best option. Overall, most people are unaware of what homeless people need, and we suppose they believe homeless and poverty are synonymous, and with this incorrect understanding, they would disregard the need for a home, just as the government did.

About a quarter would not donate to the homeless, indicating that there are still factors that prevent society from helping homeless people. This could be a misunderstanding of homeless people, where they do not believe they need help, believe they are here to scam money or are more willing to spend their money on themselves rather than helping others. Most people who responded to this survey donate once, with a proportion of 59.4%, which is probably due to the donation activity our school does each year, and finally, 13.1% of all donate regularly, which is the best approach to help a family or a homeless individual get out of their situation.
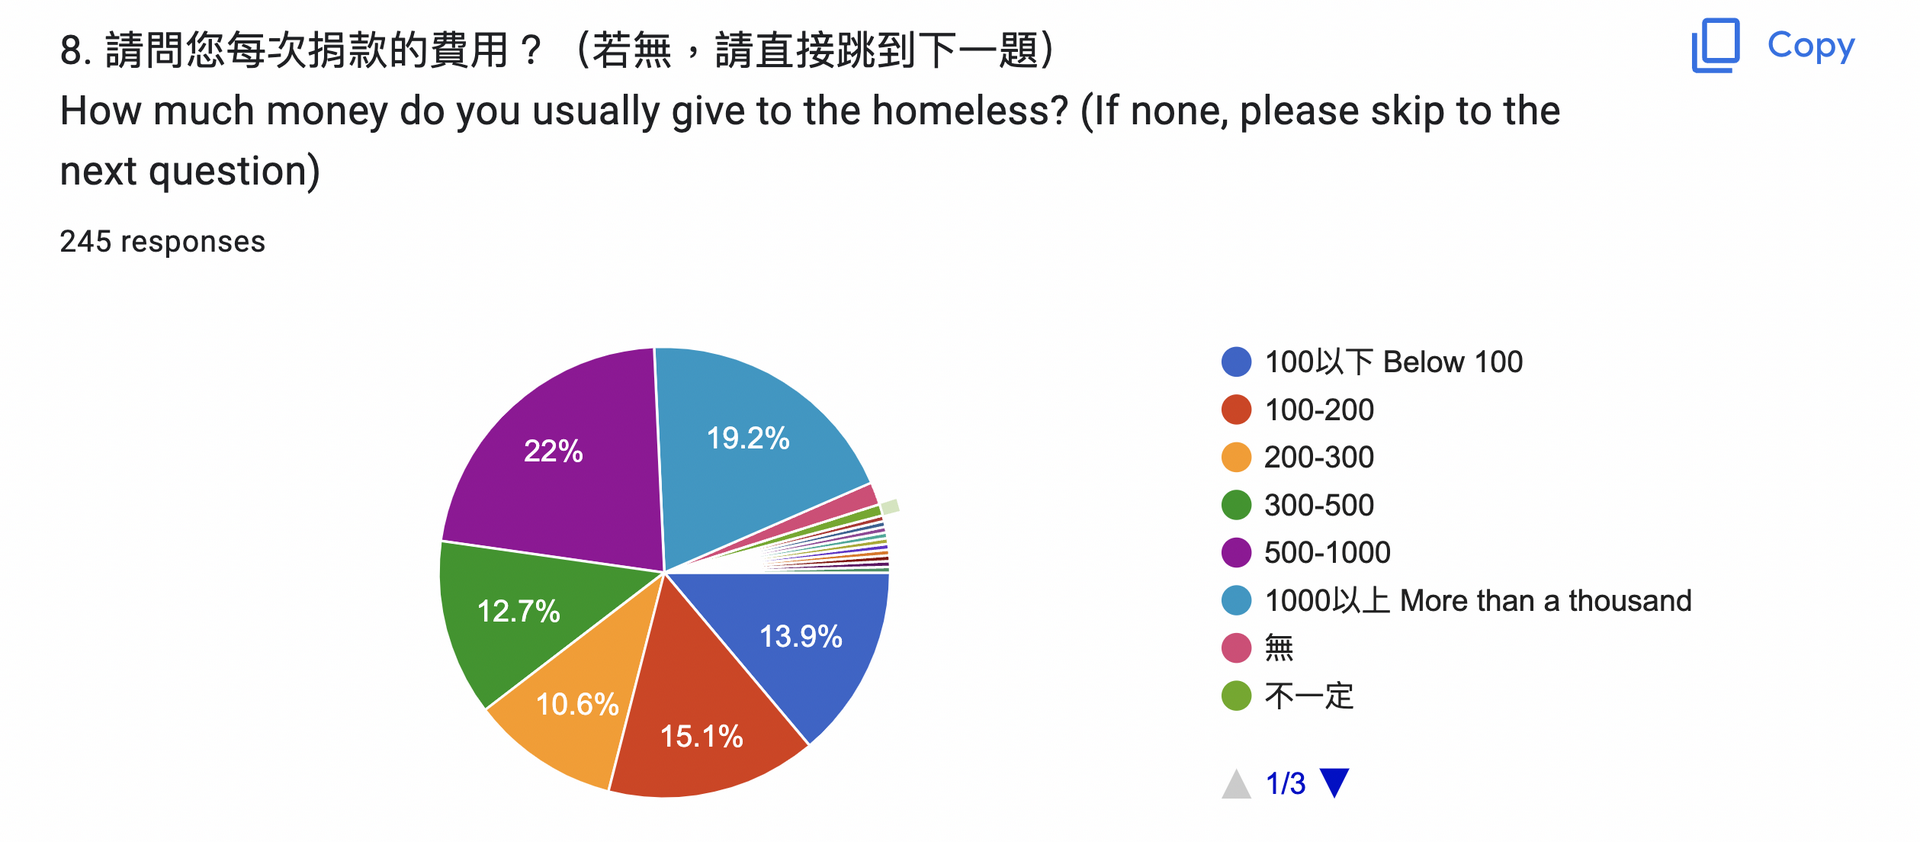
Most people donate more than 300 NTD, which is more than enough to feed a homeless person for a day. However, this money isn't enough to rent a shelter. We can deduce from this that the donors have no idea what the needs of homeless people are; they most likely believe homeless people live in poverty and do not have a job. The highest chosen number is above 500 dollars and above 1000 dollars, this indicates that watching people who are in need, most people are still willing to donate a certain amount of money to them, this can be out of their empathy since it’s not small money to donate to someone, and Taiwanese are actually nice to people in need of help.
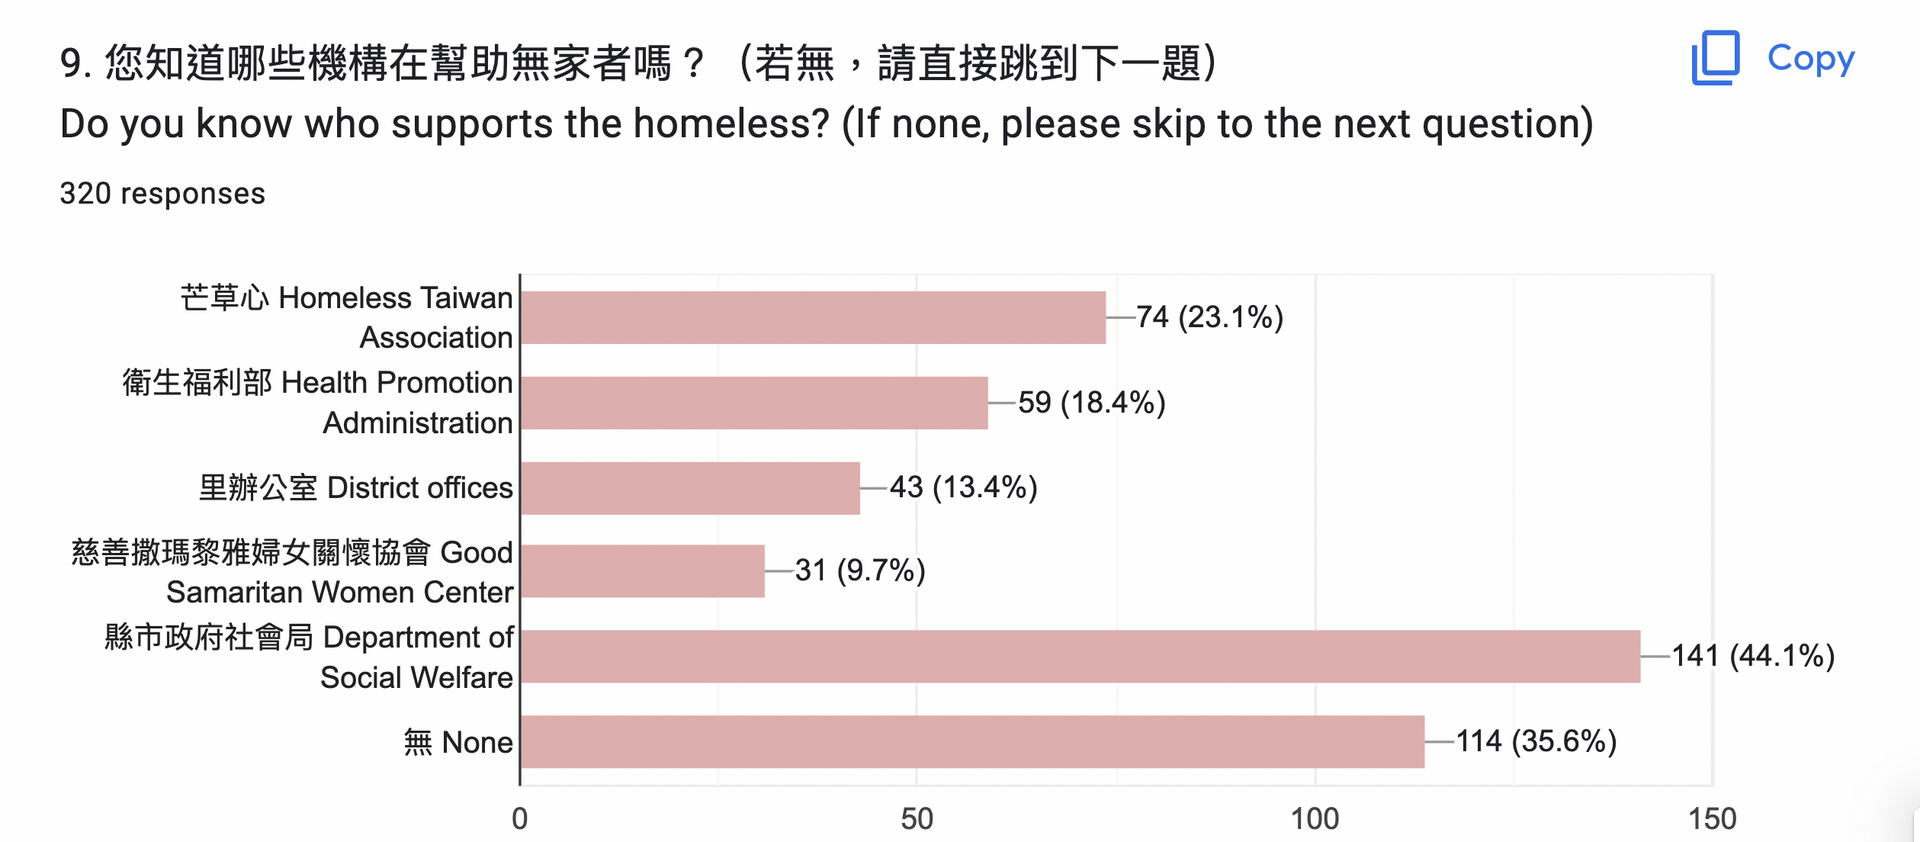
This demonstrates that the majority of individuals have a basic understanding of who and how charity assists the homeless. The Department of Social Welfare, for example, is one of the government departments that assists homeless individuals by providing goods or bailouts. NGOs that assist homeless people include the Samaritan Women's Center and the Homeless Taiwan Association. However, 35.6% of the population is unaware of who is assisting homeless people. This infers that since the topic of homelessness isn’t popular, there are still plenty of people who don’t know the basic knowledge of the homeless, which, is why our project is important.

We can infer people's attitudes toward charity from this chart. Most of them believe that charity supplies necessities such as food and clothing. Furthermore, many people believe that they would assist homeless people in finding work or teaching them skills to enable them to leave the homeless circle. According to the "others" section, there are many people who are aware that charities provide vocational training, job reference, showering, health care, and mental support.
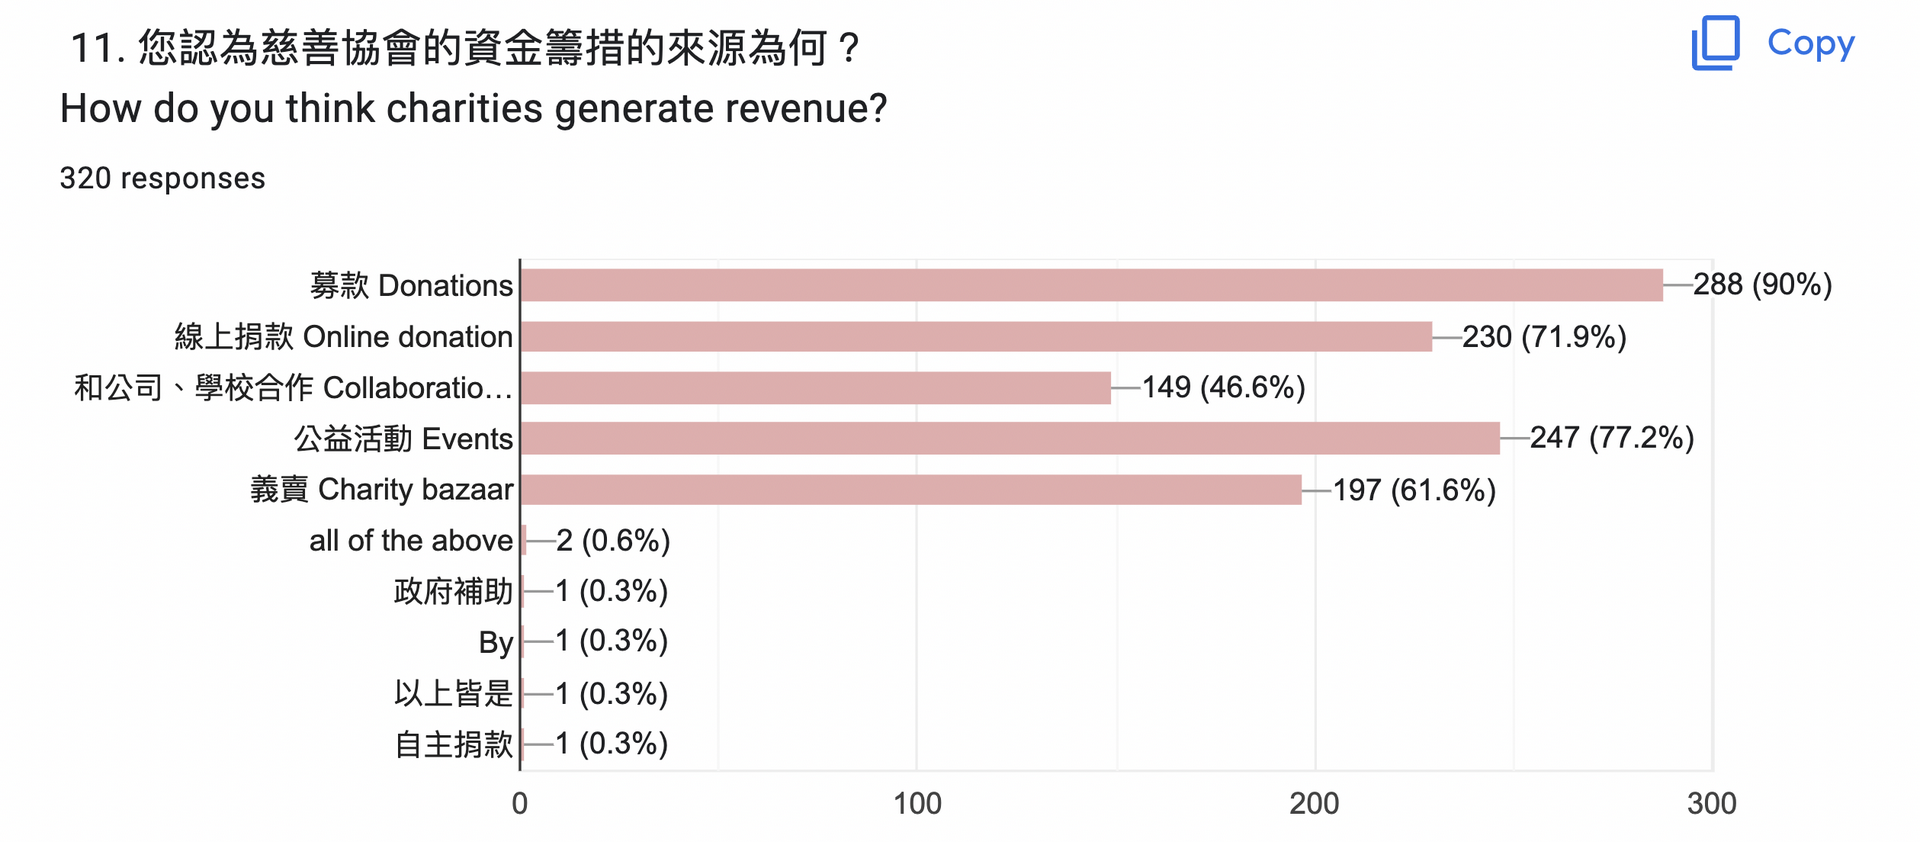
According to this graph, people believe that donations generate the majority of charity revenue, followed by public welfare and, ultimately, internet donations. Donations and event sponsorships are the most effective ways for charity to raise funds to serve people. We can infer from the fact that the majority of people chose donations that donating is the most common way they see charities make money. This may be due to our school's donation event, in which we hold an activity to raise money each year, so the students who responded to this survey would think donation is the most common way to raise money. While donations are successful and economical, other methods of raising funds include sponsoring events, trading, and selling things. While donations are successful and economical, other methods of raising funds include sponsoring events, trading, and selling things.
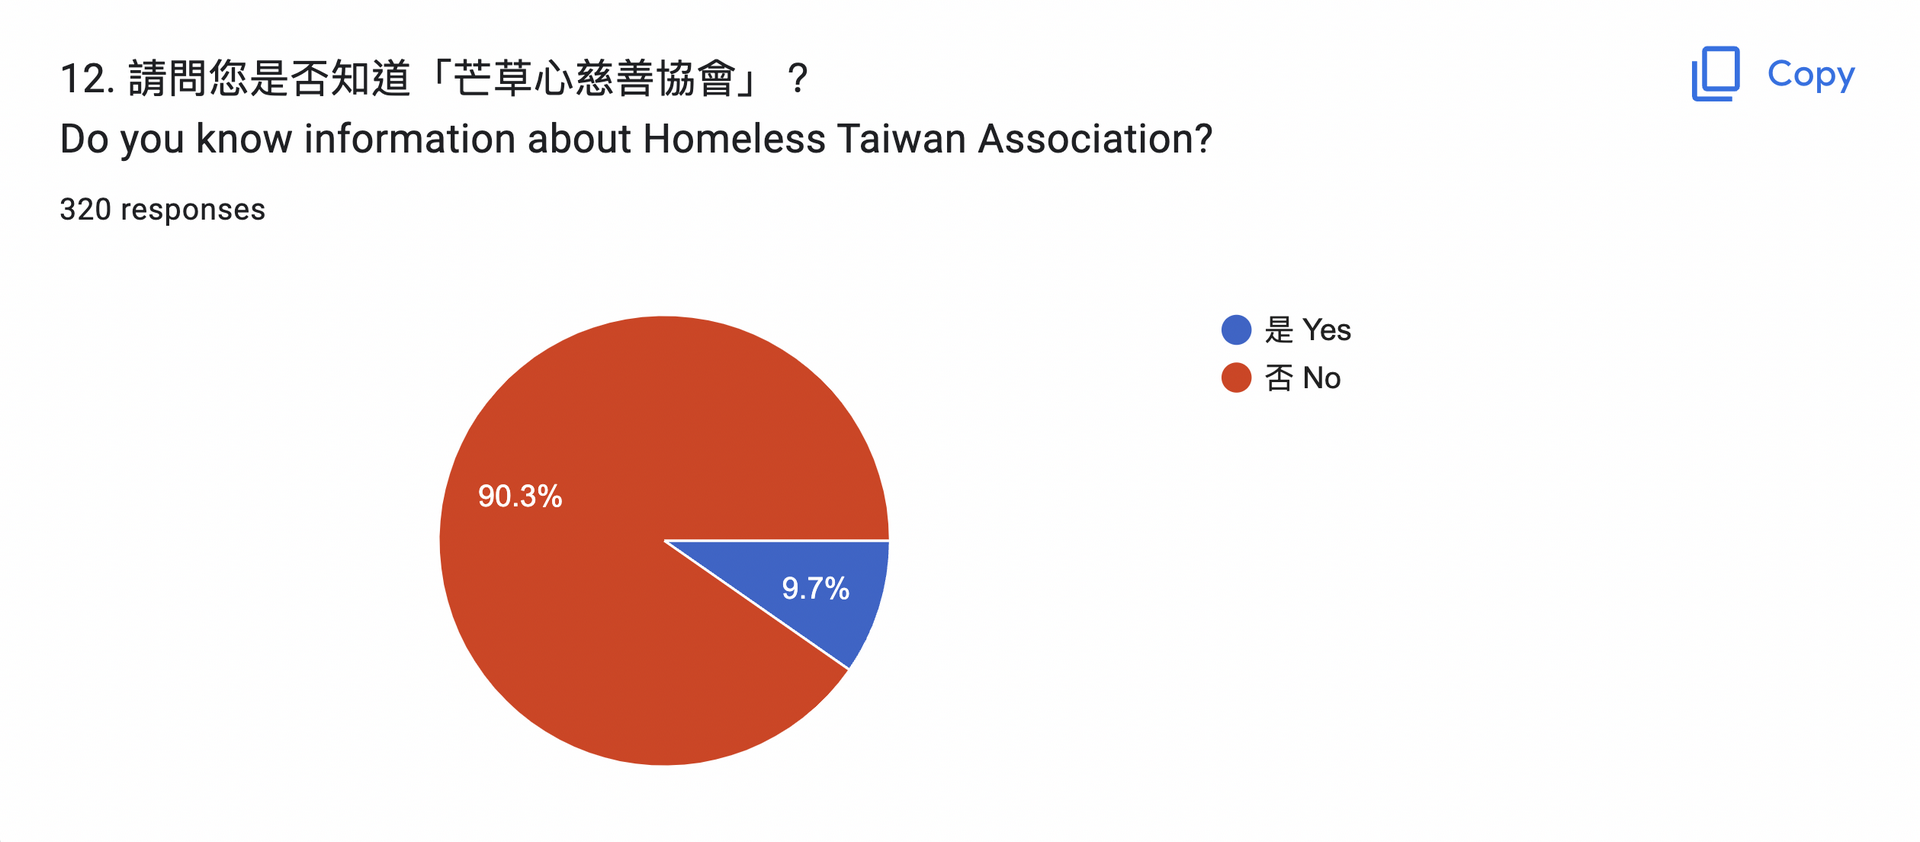
According to the graphic above, the majority of individuals are unaware of the Homeless Taiwan Association. We could also tell that not everyone takes this form seriously because, according to chart 9, 74 people say they know but only 31 say yes. This means that the Homeless Taiwan Association is still quite new as a charity, and this topic is also relatively new.
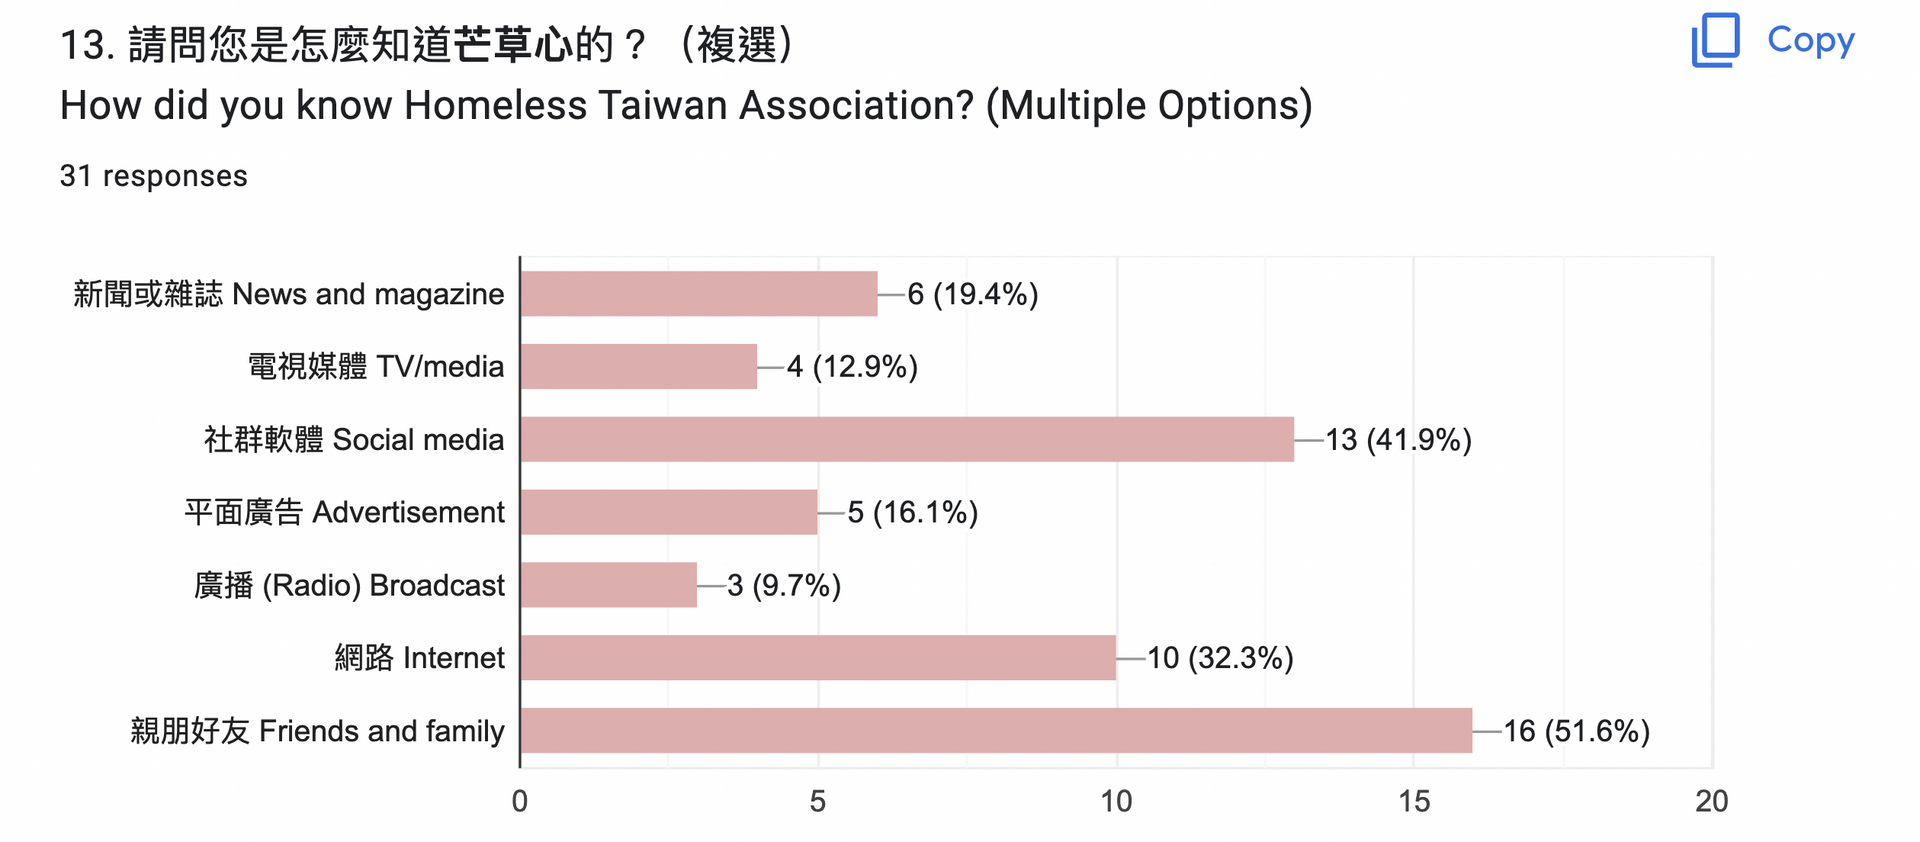
The majority of people found out about the Homeless Taiwan Association through friends or relatives, but many more found out about it through the internet, including social media and television. This demonstrates that the Homeless Taiwan Association did not invest significantly in advertising. Even though they did not undertake any advertising. Nonetheless, some people are aware of their acts and provide support to the homeless.

The ideal option is "increase the quality of life for homeless people," although approximately 10% of respondents answered incorrectly. We may deduce that not everyone who knows Homeless Taiwan Association knows what they do, hence 10% of the responses would be untrustworthy because such people have no idea what Homeless Taiwan Association does.
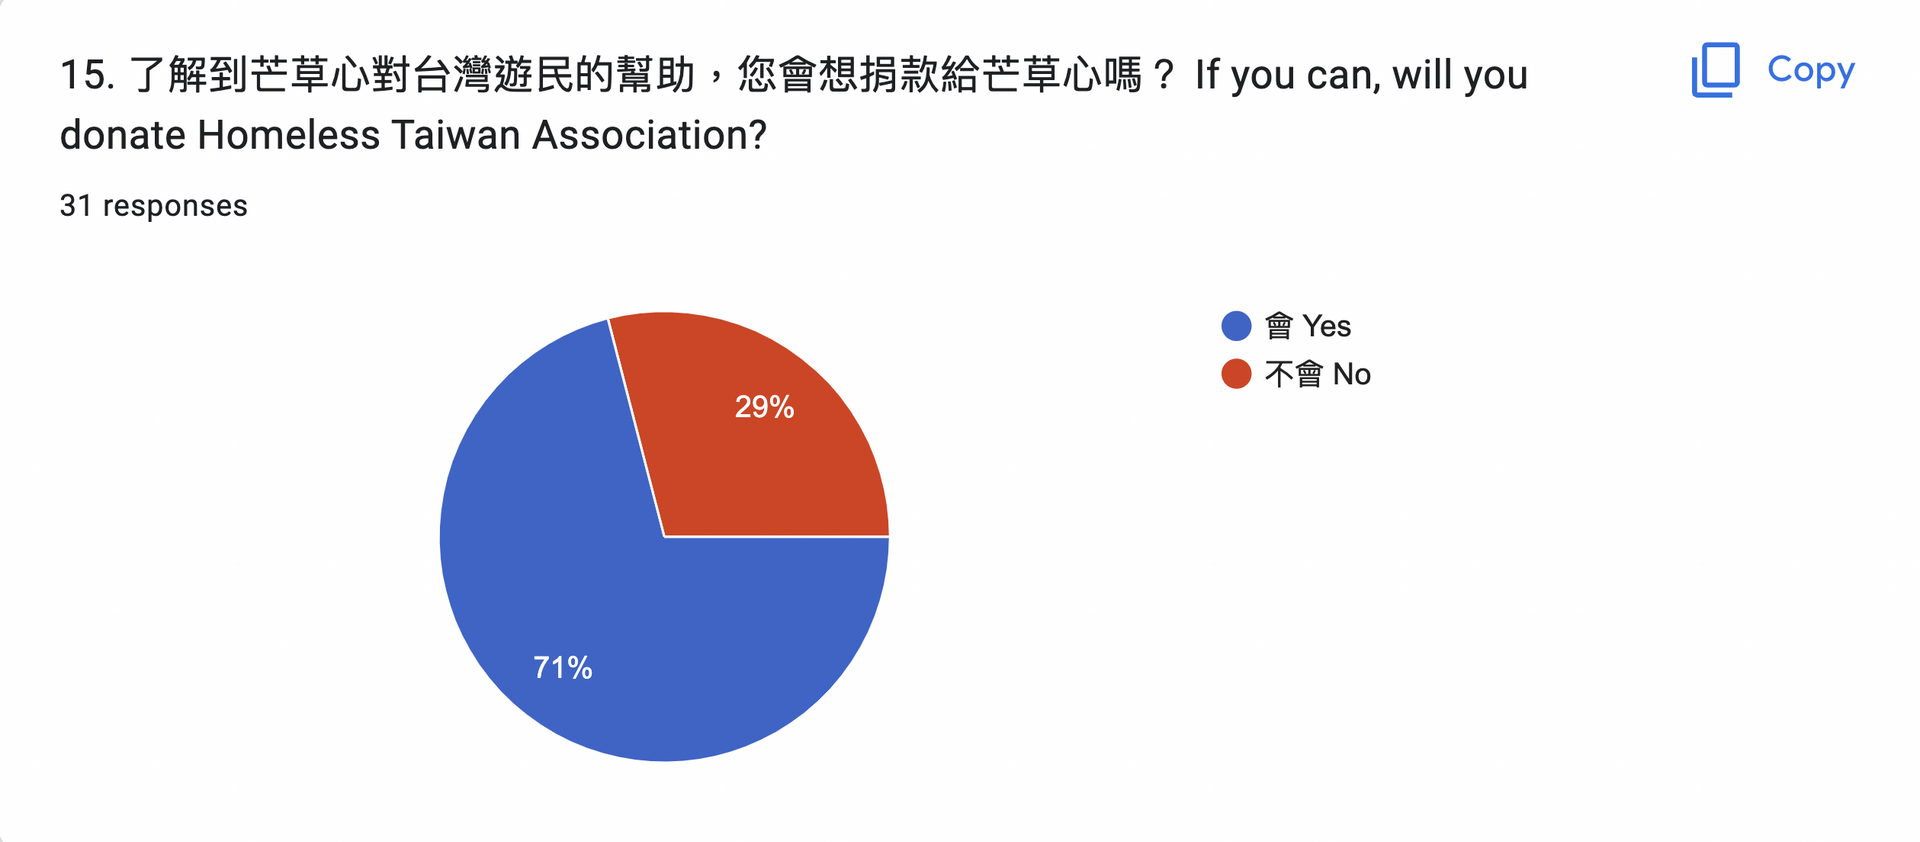
Many people have acknowledged that the situation of too many homeless people in Taiwan is significant and cannot be remedied exclusively by charities, yet most people would contribute to the charity because there are few alternative options for assisting the homeless. People who do not donate to Homeless Taiwan Association may have done so because they do not have extra money to financially support homeless people or because they are unfamiliar with Homeless Taiwan Association; therefore, the information and organization of this website would be primary in getting more people to understand how important this topic is.
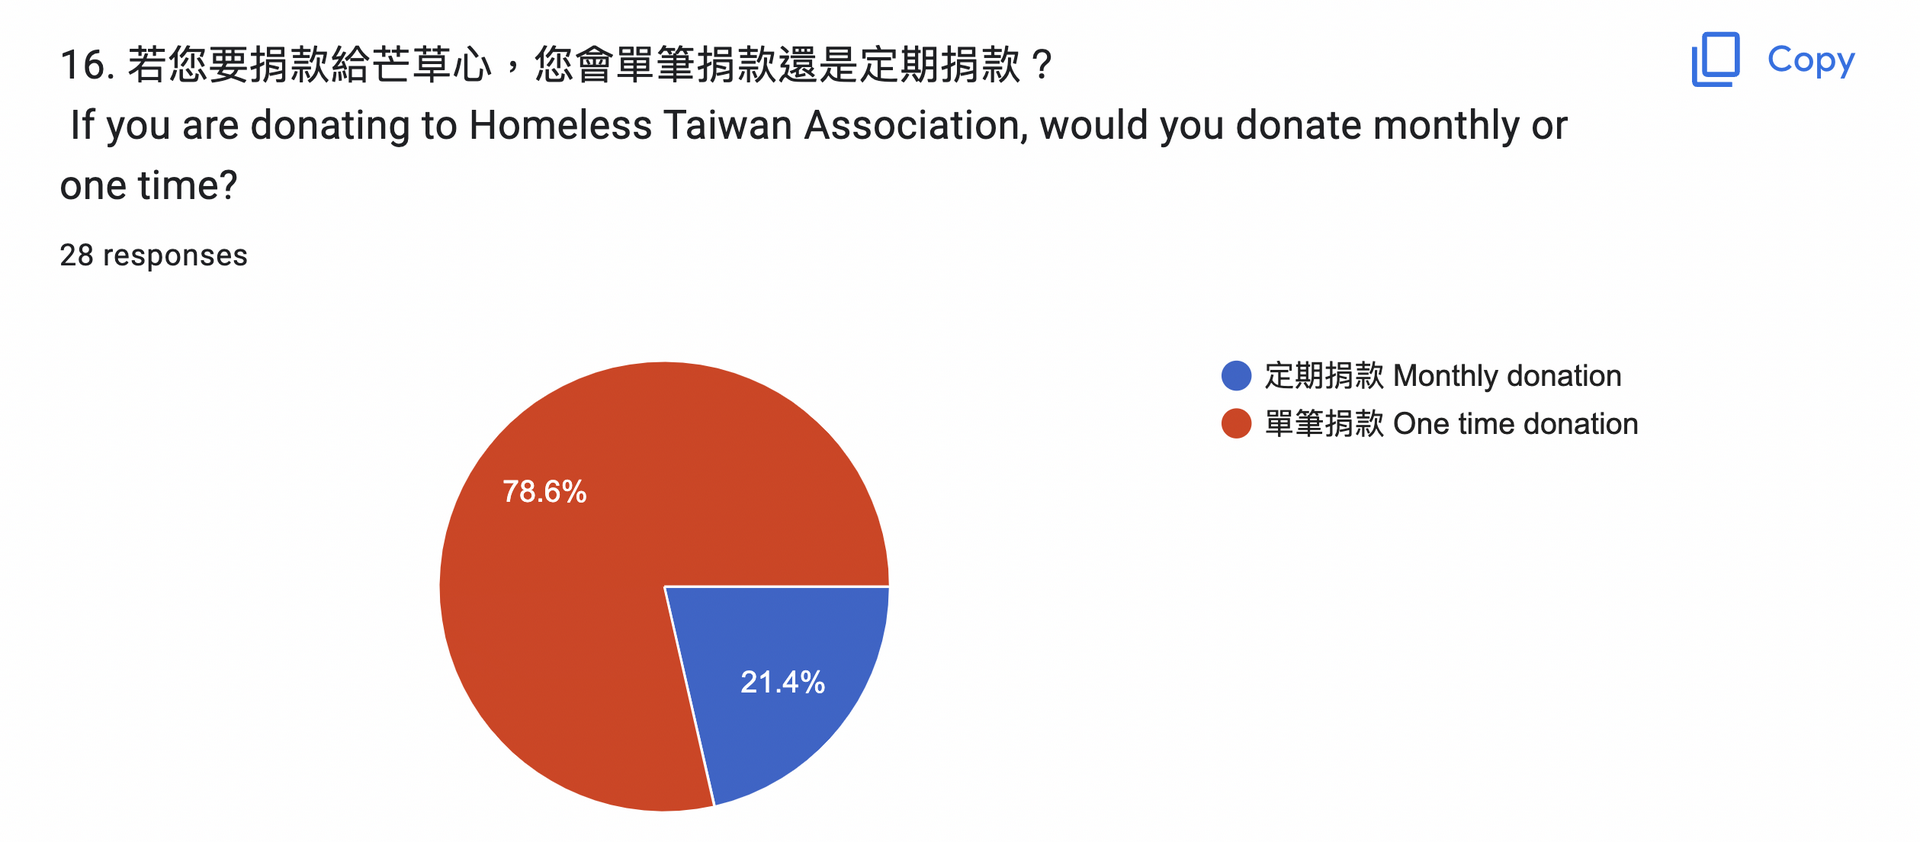
When we compare the chart of how people donate to charity, we can see that the rate of monthly donation is significantly higher, although the bulk of people are still prepared to donate once rather than monthly. This can be because they are not as familiar with the Homeless Taiwan Association yet, so they choose to donate one time.
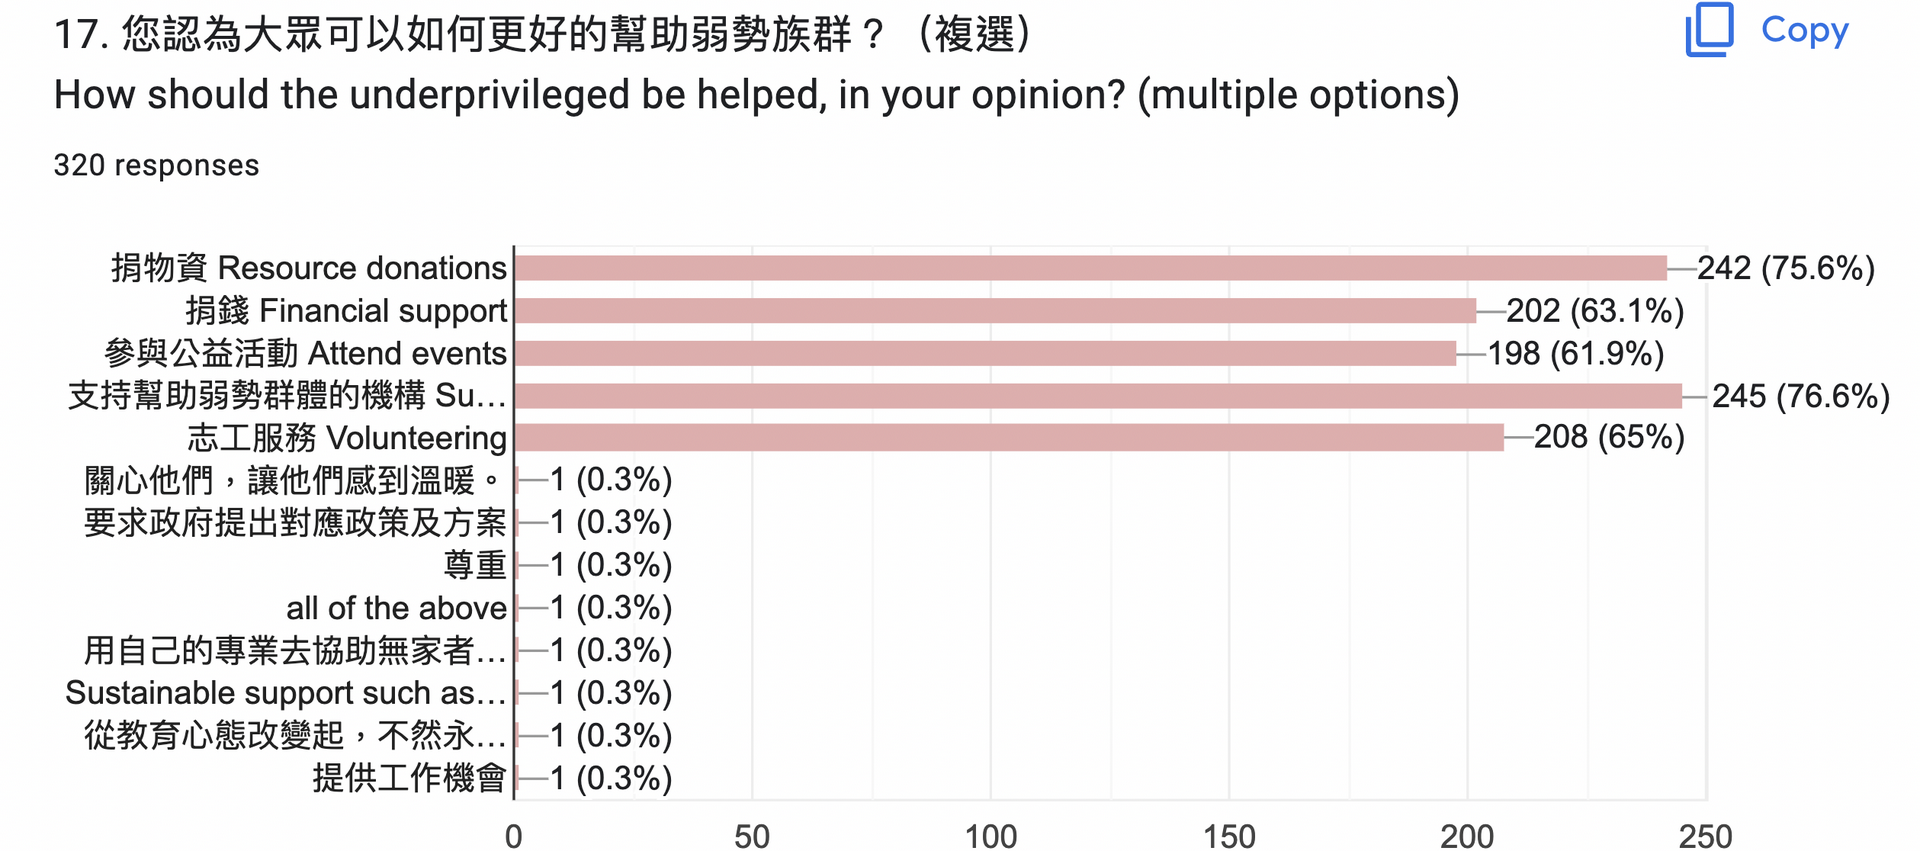
The majority of those polled thought that distributing resources and volunteering is the most effective way to help homeless people get out of their position. Although financial assistance should be the preferred option because they have jobs and can purchase resources on their own. The majority of responses are exclusively focused on the necessities of the homeless and say nothing about improving their mental health. According to the Homeless Taiwan Association, their mental health is equally important, thus they offer counseling and work opportunities to assist homeless people in returning to normal life. We can see from this that most people still classify homelessness and poverty as the same state, even though they are completely different; we feel this is also evidence of how the general public has a misunderstanding of homeless populations.